
It goes without saying: we love all things tech…
Whether it’s the latest advancements in AI, game-changing tools that streamline our workflows, or techy gadgets that make life a bit more fun, we’re always sharing our finds in the LeftBrain #coolstuff Slack channel. And now, we’re bringing some of our discoveries directly to you on the LeftBrain blog.
Please note: LeftBrain doesn’t necessarily endorse these technologies, we just think they’re cool.
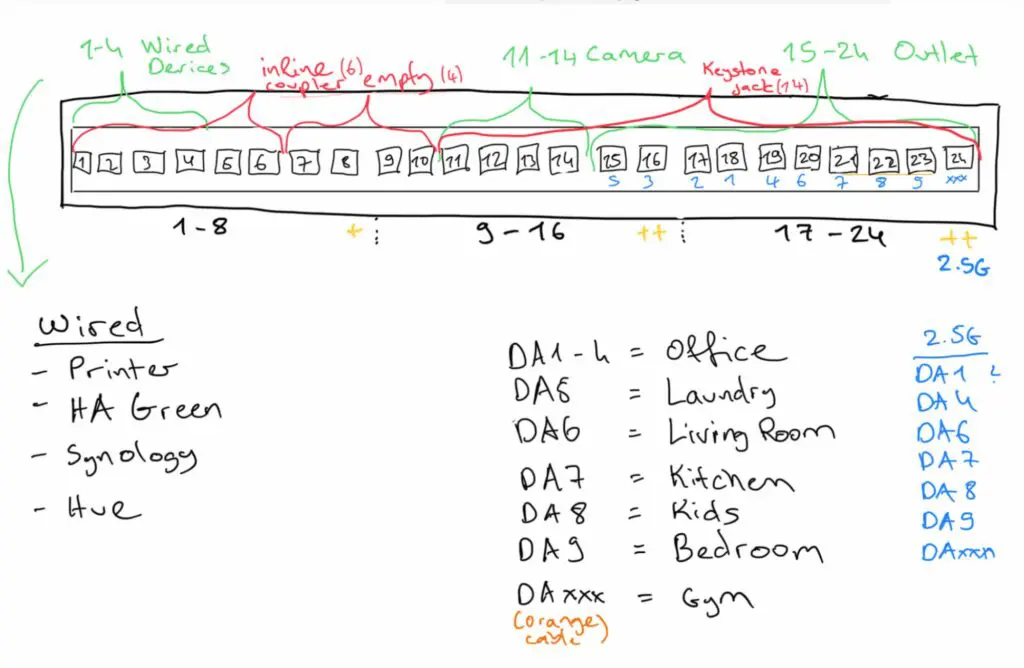
Fatih Arslan on building a dream homelab with UniFi
An epic homelab setup where concrete walls and Wi-Fi signals clashed. The author, Fatih Arslan, started with TP-Link gear but later switched to Ubiquiti Unifi devices for better performance and control. Featuring multiple access points, cameras, and creative solutions like custom mounts, it’s a masterclass in optimising home tech. VLANs, dual WANs, and network tweaks makes this a dream setup.
Read the article
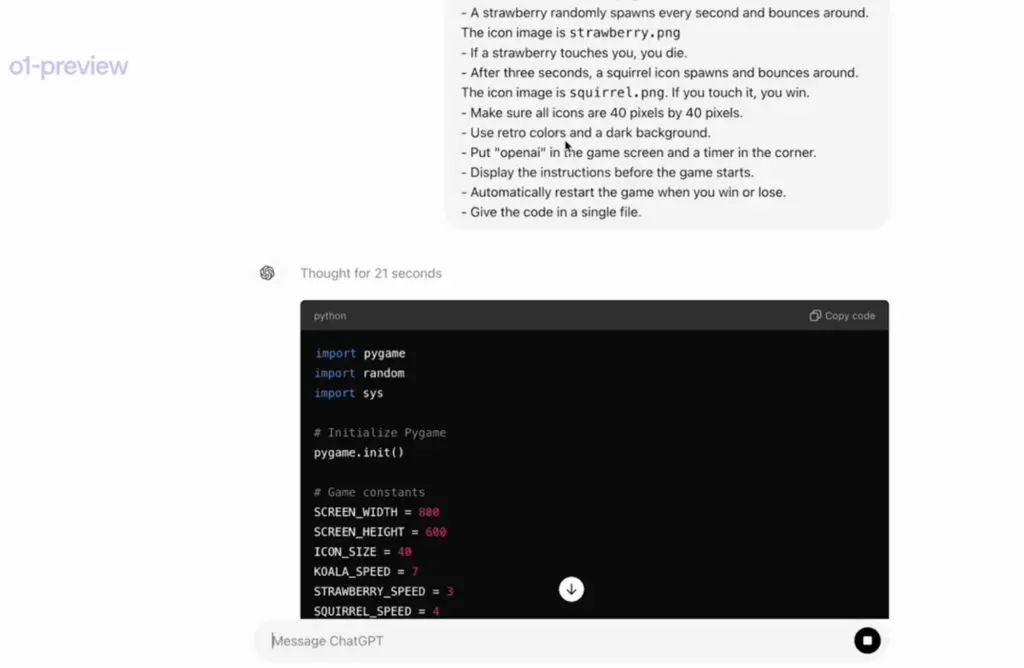
Coding video games with OpenAI o1
OpenAI has unveiled its new AI model, OpenAI o1 (previously known as Project Strawberry/Q*), which can now code entire video games from a single prompt. The model excels in reasoning, math, and programming, improving its performance the longer it “thinks.” It ranks in the 89th percentile on competitive programming challenges and successfully solved 83% of the problems on a qualifying exam for the International Mathematics Olympiad (IMO), making it a breakthrough in AI capabilities.
Watch the video on X
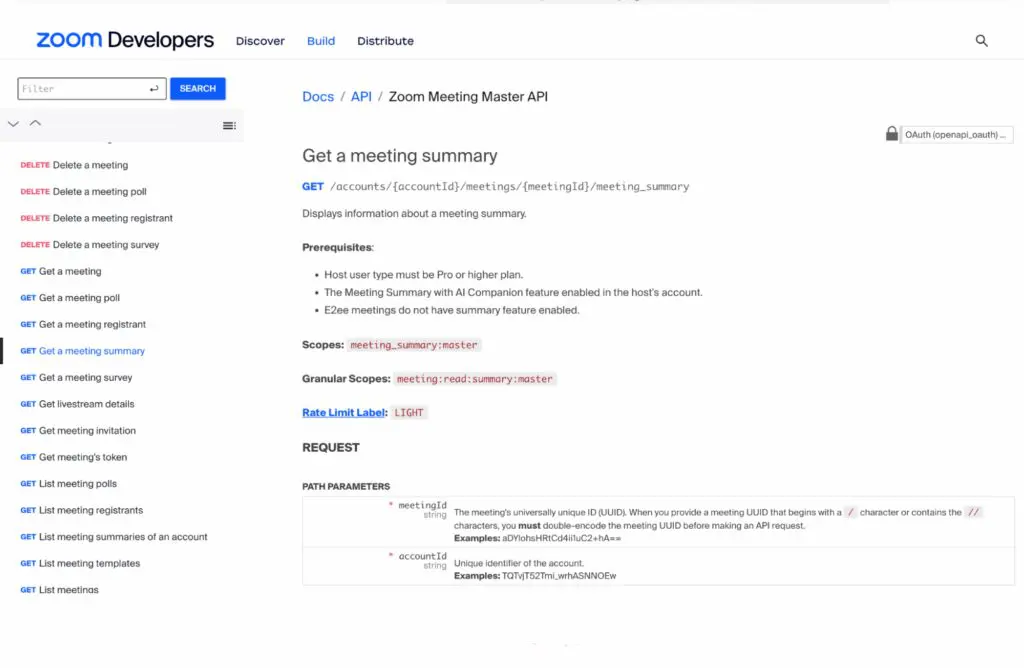
Zoom Meeting Master API
The Zoom API now makes it possible for developers to extract detailed AI meeting transcripts and summaries, enabling us to automate the process of capturing information from team calls. This has already been a game changer for us at LeftBrain. The API records stats like number of attendees, meeting duration, and participant engagement. It can then pull these summaries into various applications, making it easier to integrate Zoom meeting data with project management tools, CRMs, or any other custom systems, providing a streamlined way to process and analyse meeting outcomes.
Find out more
Cursor: code with AI
Cursor is a product that includes a powerful autocomplete that predicts your next edit. Once enabled, it is always on and will suggest edits to your next code across multiple lines, taking into account your recent edits. The chat lets you talk with an AI that sees your codebase and add particular blocks of code to the context. It also lets you write code using instructions, and update entire classes or functions with a simple prompt.
Find out more
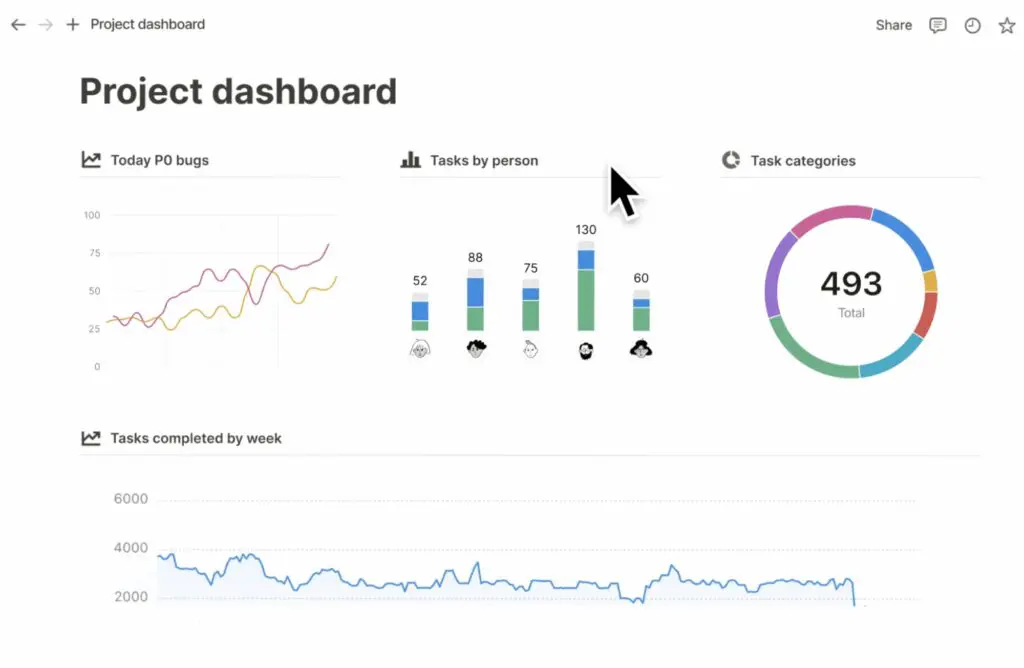
Notion Charts
We’re pretty pumped with the new Notion Charts, that allow you to turn any database into a chart with just one click. You can add a chart to any Notion page or database, by typing /chart and picking your source. They are customisable, and can trigger an action when a task is marked ‘high-priority’.
Find out more
Let’s get started
We work with fast-moving innovative teams who expect clarity, pace and iteration. If you’re scaling fast and want delivery partners who truly work like you do, we’d love to help.